Map of Ocean Beach CA: Real Estate Insights
Justin Halbert | Point Loma | Luxury Real Estate
Map of Ocean Beach, San Diego - A Locals Perspective
Most advice about a map of Ocean Beach CA is too shallow to help with an actual real estate decision. A tourist map can help you find the pier. It won't tell you why two homes that look close on paper trade in different value tiers, or why one block carries more negotiation power than the next.
If you're buying or selling in Ocean Beach, the useful map isn't just streets and landmarks. It's a strategist's map that layers history, micro-neighborhood identity, walkability, flood exposure, and erosion risk onto the same geography.
Table of Contents
- Why a Standard Map of Ocean Beach Fails Buyers and Sellers
- What the normal map misses
- An Interactive Real Estate Map of Ocean Beach
- Read the map in layers
- Why this matters to pricing
- Mapping the Micro-Neighborhoods of Ocean Beach
- Ocean Beach Micro-Neighborhood Snapshot
- How to read each pocket
- The Invisible Overlays That Determine Value
- View tiers are not all equal
- Parking and Newport access
- Decoding Environmental and Flood Risk on the Map
- What buyers should look for
- What sellers often underestimate
- How Buyers and Sellers Can Use This Map to Win
- For buyers
- For sellers
- What works and what doesn't
Why a Standard Map of Ocean Beach Fails Buyers and Sellers
A standard map of Ocean Beach CA usually shows streets, parks, commercial nodes, and maybe zoning or flood boundaries. That's useful for orientation. It's weak for valuation.

The gap is straightforward. Existing Ocean Beach maps from planning boards or tourism sites don't integrate real estate-specific data, and even where flood zones are shown, they aren't tied to market behavior such as high-flood-risk properties in OB seeing a 12% slower appreciation rate from Q1 2025 to Q1 2026, according to Ocean Beach map resources and related local market commentary.
What the normal map misses
- Value boundaries: Buyers don't pay by neighborhood name alone. They pay by block feel, parking ease, view corridor, and exposure.
- Decision friction: A parcel can look attractive on a screen and become less attractive once you account for permit complexity and environmental disclosures.
- Equity protection: Sellers who ignore these overlays often price off broad comps instead of true competitive comps.
A good coastal map helps you navigate. A good real estate map helps you avoid expensive assumptions.
If you're tracking larger San Diego housing context alongside OB-specific signals, this San Diego real estate 2025 recap and 2026 outlook is a useful companion read.
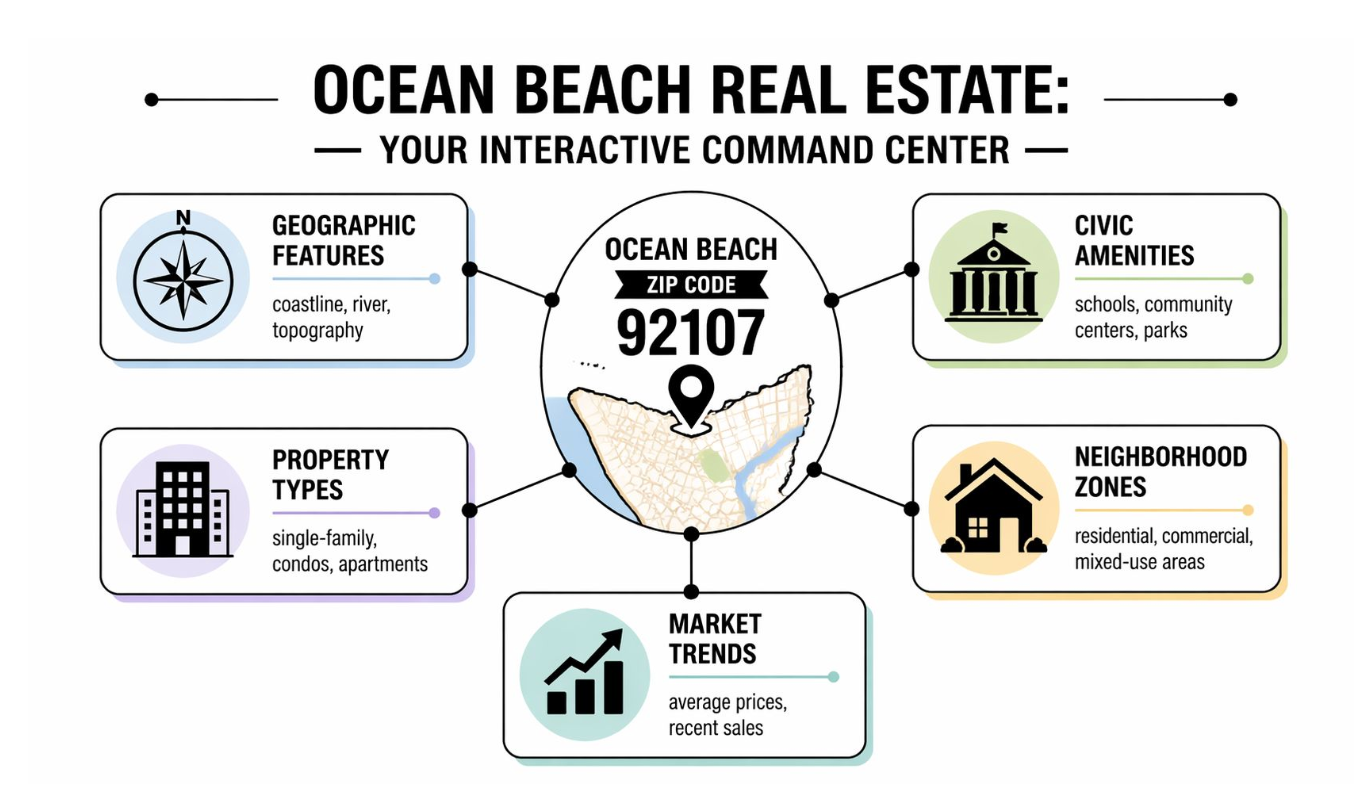
A Real Estate Map of Ocean Beach
Street names are the easy part. The hard part is seeing which blocks in Ocean Beach hold value better, which ones trade at a discount for good reason, and which ones look similar on a standard map but sit in completely different risk and demand tiers.
Ocean Beach sits between the open coast, the San Diego River corridor, and a street grid that changes character fast. That geography is why a strategist's map matters more than a standard locator map. Buyers are not just choosing distance to sand. They are choosing view tiers, traffic exposure, parking friction, flood sensitivity, and how much commercial activity they are willing to absorb for a given price point.
Read the map in layers
Start with hierarchy, not proximity.
Newport Avenue is the commercial spine, and that affects pricing in both directions. Some buyers pay a premium for being able to walk to restaurants, the farmers market, and the beach culture they came for. Others discount the same location because of noise, parking competition, and heavier visitor traffic. One block can shift a property from "classic OB convenience" to "too much spillover."
Sunset Cliffs Boulevard carries a different signal. It reads as more scenic, more status-conscious, and in certain pockets, more protected from the day-to-day congestion that drags on buyer enthusiasm elsewhere. Inland edges often pull a different buyer profile altogether. Those homes can trade well when they offer easier parking, a more residential feel, or cleaner access in and out of the neighborhood.
I tell clients to layer the map this way:
- View tiers: White-water, partial ocean, canyon, and no-view product do not compete the same way, even when square footage looks close on paper.
- Access and congestion: Fast beach access sounds good until the block also becomes a cut-through or a parking hunt every weekend.
- Use pattern: Purely residential pockets usually attract a broader resale pool than homes pressed too tightly against mixed-use activity.
- Lifestyle friction: Alley access, lot fit, and day-to-day parking matter more in OB than many out-of-area buyers expect.
For clients comparing coastal neighborhoods with a more family-oriented setup, this breakdown of the top Point Loma neighborhoods for families and fun is a useful contrast.
Why this matters to pricing
A standard map tells you where the home is. A real estate map should tell you how the block is likely to be judged by the next buyer.
That distinction affects pricing strategy from day one. A property can be west of the main drags and still underperform if its parking setup is poor, its exposure is noisy, or its usable outdoor space feels compromised. Another home farther from the sand can hold value better because the living experience is easier. In Ocean Beach, easier often wins.
Use the map to answer the questions that move price:
- Does this address sit in a high-demand lifestyle pocket or a pocket with built-in objections?
- Is the premium here being driven by a durable feature, such as a superior view tier or cleaner residential setting, or by broad neighborhood hype?
- Will the next buyer see this block as convenient, constrained, or compromised?
Practical rule: In Ocean Beach, the best location is usually the one that delivers the beach feel without the daily irritation tax.
Mapping the Micro-Neighborhoods of Ocean Beach
Ocean Beach isn't one market. It's a patchwork of micro-markets, and buyers who treat it as a single bucket usually misread value.
Its layout also has deep historical roots. J.M. DePuy's initial subdivision map was filed on April 22, 1885, predating the better-known 1887 Ocean Beach map by Carlson and Higgins, whose later subdivision established much of the resort-style street grid still felt today, according to the San Diego History Center account of Ocean Beach's early mapping.
Ocean Beach Micro-Neighborhood Snapshot
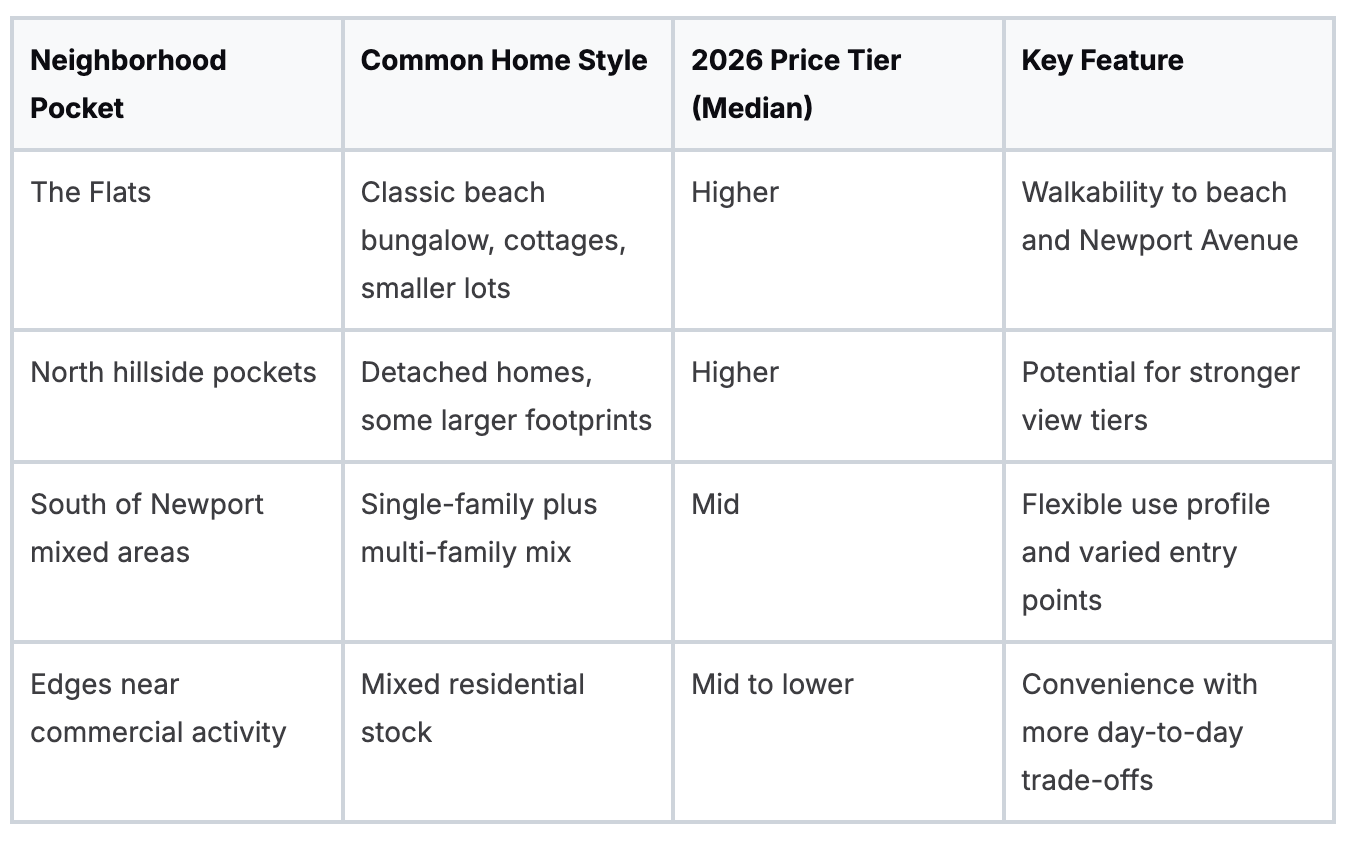
The table above is qualitative by design. In OB, the exact street and lot characteristics matter more than a broad label.
How to read each pocket
The Flats appeal to buyers chasing the classic Ocean Beach identity. They tend to accept tighter lots and parking friction because the lifestyle is immediate and visible.
Hillside areas attract a different buyer. They usually care more about view tiers, privacy, and the sense that they're buying a stronger long-term position, not just beach proximity.
South of Newport can work well for buyers who want optionality. The housing mix changes the feel, and that can either broaden appeal or narrow it, depending on the property's condition and layout.
- Lifestyle-first buyers: Usually prioritize the Flats.
- Equity-minded buyers: Often study hillside streets more carefully.
- Investors and flexible-use buyers: Typically spend more time south of Newport.
For readers comparing broader coastal neighborhood trade-offs, these Point Loma neighborhoods for families and fun offer a useful contrast to OB's denser beach-grid pattern.
The Invisible Overlays That Determine Value
The most important layers on a map of Ocean Beach CA usually aren't printed on the base map. Buyers feel them when they tour.
By 1910, Ocean Beach had 100 houses, and that shift into a real resort town was driven by D.C. Collier's 1907 investment in housing, infrastructure, a public streetcar line, and a school, establishing an early pattern where transit access and walkability supported value, as documented in the City of San Diego's Ocean Beach planning history.
View tiers are not all equal
A real sit-down ocean view from primary living space is different from a peek view from a secondary room. Buyers know the difference quickly, even if listing language tries to blur it.
That creates tiers inside the same street.
- Clean primary view corridor: Stronger emotional pull and broader premium-buyer interest
- Partial or angle-dependent view: Still valuable, but more negotiable
- No meaningful view but close location: Can still trade well if walkability and parking are strong
Parking and Newport access
Parking is one of the least glamorous drivers of value in Ocean Beach, and one of the most important. A garage or dependable off-street setup changes daily livability. In dense coastal neighborhoods, that matters more than many sellers realize.
Proximity to Newport Avenue also needs nuance. Some buyers want immediate access to cafes, retail, and the social energy. Others want to walk there easily without hearing it or fighting for curb space near it.
The winning location in OB is often one that gives you access without forcing you to absorb every consequence of that access.
Decoding Environmental and Flood Risk on the Map
A clean block in Ocean Beach can still carry expensive friction. That is why a strategist's map matters more than a standard street map here. You are not just locating a house. You are locating exposure, insurance pressure, permit complexity, and the buyer objections that show up later in escrow.
In OB, small geographic shifts change the risk profile fast. A property closer to the shoreline, sitting lower, or falling inside a more sensitive coastal review area can look similar on a listing sheet and trade very differently in the market. Buyers price that uncertainty in. Lenders, insurers, and contractors do too.
What buyers should look for
Start with the parcel, then study the overlays that affect ownership after closing.
- Flood zone position: The issue is not only whether the parcel touches a flood designation. The issue is what that does to insurance cost, lender requirements, and future resale conversations.
- Coastal permitting exposure: Homes in lower-lying or more tightly regulated coastal areas can face slower approvals for additions, hardscape, drainage work, and other exterior changes.
- Topographic context: In Ocean Beach, even modest elevation differences can change standing-water concerns and long-term buyer comfort.
- Street-level drainage pattern: Some blocks shed water better than others. That matters during heavy rain and it matters again when a future buyer compares two similar homes.
I tell clients to separate scenic risk from structural risk. A property can have strong coastal appeal and still come with enough environmental resistance to cap appreciation.
What sellers often underestimate
Sellers usually focus on upgrades, design, and the nearest comparable sale. Those factors matter, but they do not control the whole pricing conversation in a neighborhood where geography quietly filters the buyer pool.
A house outside the more obvious exposure pockets often gets a smoother reception, even if the finishes are less polished than a competing listing. Buyers tend to accept cosmetic work. They discount uncertainty much harder. That is why two homes with similar square footage and similar proximity to the beach can sit in different value bands once you layer in flood exposure, erosion concern, and permitting drag.
Field note: In OB, environmental risk acts like a hidden adjustment factor. The more future friction a buyer sees, the more they protect themselves on price, contingency structure, and repair demands.
Low-lying homes still sell. They just need sharper positioning. Clear disclosures, insurance clarity, and realistic pricing do more for these properties than lifestyle copy ever will. For owners weighing whether to hold, sell, or keep a coastal property as part of a longer-term plan, this San Diego buying versus renting analysis gives useful context on ownership math under changing costs.
How Buyers and Sellers Can Use This Map to Win
The best use of a map of Ocean Beach CA isn't academic. It's tactical.
The environmental side matters here too. Coastal erosion rates of 1-3 meters per year have been linked to property stability concerns, and waterfront listings without proven mitigation can see 10-15% value erosion, according to the USGS coastal erosion analysis referenced for this discussion. That should influence how buyers underwrite risk and how sellers prepare their positioning.
For buyers
A buyer gains an advantage by identifying homes with fixable flaws instead of permanent flaws.
- Fixable issue: Dated finishes, weak presentation, or an awkward marketing strategy
- Hard-to-fix issue: Inferior view tier, persistent parking friction, or environmental exposure
- Best setup: A home with strong location fundamentals and cosmetic upside
When you're weighing long-term ownership against flexibility, this San Diego buying versus renting guide adds useful context around the hold decision.
For sellers
A seller should build the story around the map, not around the feature sheet alone.
If a property sits in a stronger location pocket, outside the most problematic exposure, with good parking and a clean lifestyle pattern, that needs to be made obvious. Buyers won't always connect those dots on their own.
Use the listing narrative to answer the buyer's silent questions:
- Why this block instead of the one closer to the sand?
- Why is this home easier to live in full-time?
- Why does this property protect equity better than a seemingly comparable alternative?
What works and what doesn't
What works is specificity. Show the buyer the exact advantage. Better parking setup. Superior view corridor. Cleaner position within the neighborhood grid. Lower practical friction.
What doesn't work is vague coastal marketing. "Beach close" isn't a strategy. Neither is pretending that all OB locations perform the same.
Buyers pay premiums for clarity. They negotiate hardest when the map reveals unresolved risk.
If you read Ocean Beach through the right overlays, the neighborhood gets easier to understand. Not simpler, but clearer. And in a coastal market, clarity is where advantage starts.
If you're buying or selling along the coast and want help reading the underlying value layers behind a property, Justin Halbert - REALTOR® brings a strategy-driven, hyper-local approach to Point Loma and coastal San Diego. From pricing and positioning to negotiation and micro-market analysis, the focus is simple. Protect equity, create advantage, and make smarter real estate decisions.